
When we talk about Russian and Chinese influence in Central Asia, it is tempting to imagine a competition with a relatively straightforward outcome. Russia historically dominated the region, with recent developments showing China out pacing Russia in investing as well as trading (Hess 2024). Eventually, one replaces the other. Wealth swaps hands. Put the relationship on a map, however, and the mosaic becomes considerably messier to understand.
Central Asia—Kazakhstan, Kyrgyzstan, Tajikistan, Turkmenistan and Uzbekistan—sits at the intersection of Russian, Chinese, European, Turkish and increasingly Gulf interests (Algermißen 2026). Russia’s full-scale invasion of Ukraine has made questions about the region’s geopolitical orientation particularly important. At the same time, China has expanded its economic presence through trade, infrastructure and the Belt and Road Initiative (Hillman & Sacks 2021).
Rather than asking simply whether China is “replacing” Russia, digital methods allow us to ask a different question: what does influence actually look like when we try to map it?
The Problem with Mapping “Influence”
Influence is an appealing word because it can mean almost anything. Trade is influence. So is infrastructure, military relationships, migration, energy dependence, investment, language and political ties. Yet a map based on only one of these can give a dramatically different picture of Central Asia.
Trade provides perhaps the most striking example: Chinese customs data put trade between China and the five Central Asian states at approximately $94.8 billion in 2024, up from $89.4 billion the previous year. Kazakhstan alone accounted for $43.8 billion, followed by Kyrgyzstan at $22.7 billion and Uzbekistan at $13.8 billion (Otorbaev 2025).
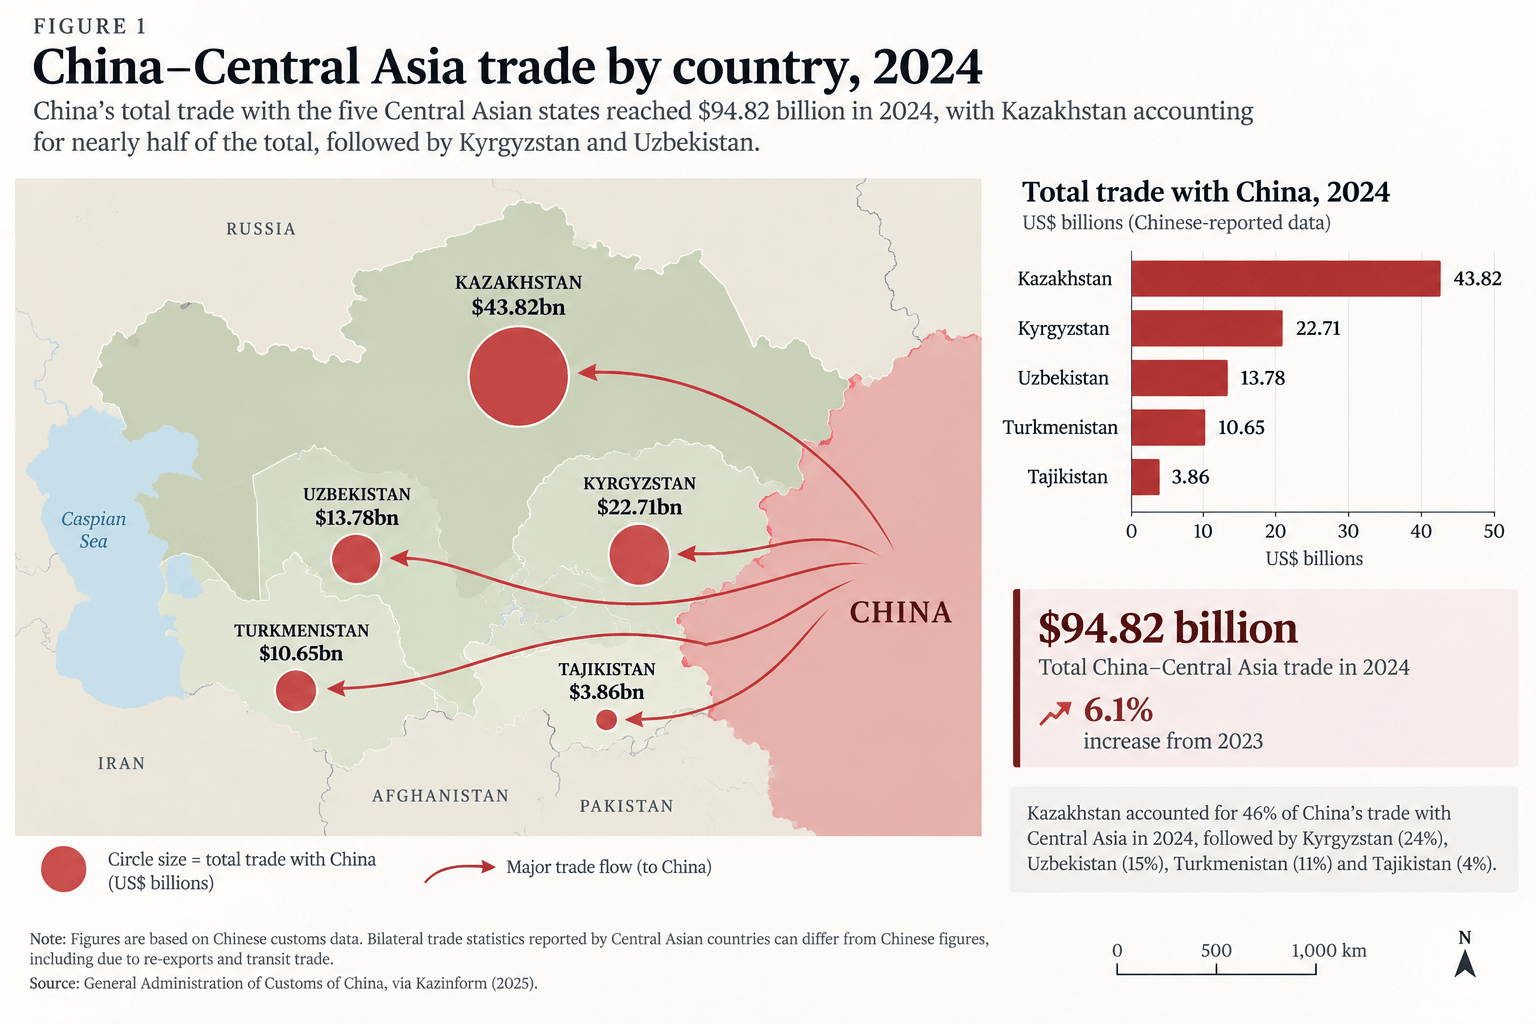
Figure 1: China–Central Asia trade by country, 2024. Source: General Administration of Customs of the People’s Republic of China (2025), 2024 bilateral trade statistics, as reported by Otorbaev (2025).
This is where digital humanities methods become particularly useful. Viewed through trade alone, China’s position looks formidable. This visualisation shows not only an increase in the quantity of goods crossing borders, but rather the very infrastructure physically changing the geography of Central Asia. Railways, roads, pipelines, and border crossings increasingly connect the region eastward (Ahmad Khan 2025). By transforming investment records into geographical visualizations, researchers can identify spatial patterns of Chinese influence that are difficult to discern from financial figures alone. Mapping infrastructure projects reveals not only where Chinese investment is concentrated, but also how individual projects connect to form wider networks of economic and strategic influence.
AidData’s Global Chinese Development Finance Dataset, for example, contains geospatial information on Chinese-financed projects around the world (Goodman et al. 2024). Filtering these records for Central Asia allows us to plot geographically rather than simply seeing a collection of dollar amounts in a spreadsheet. The location and connectivity of infrastructure can be just as significant as its financial value, and this distinction is more effectively realised visually. A relatively modest investment in a strategically positioned border crossing, for instance, may have implications for regional trade routes that are not immediately apparent from its monetary value. These maps show how China’s economic engagement translates into a changing physical and geopolitical landscape.
The Central Asia–China gas pipeline is a particularly revealing illustration. Its routes connect Turkmenistan’s gas fields with China through several Central Asian states (Aminjonov 2021). AidData records, for example, Chinese financing associated with the planned Line D route through Tajikistan, Kyrgyzstan and Uzbekistan.
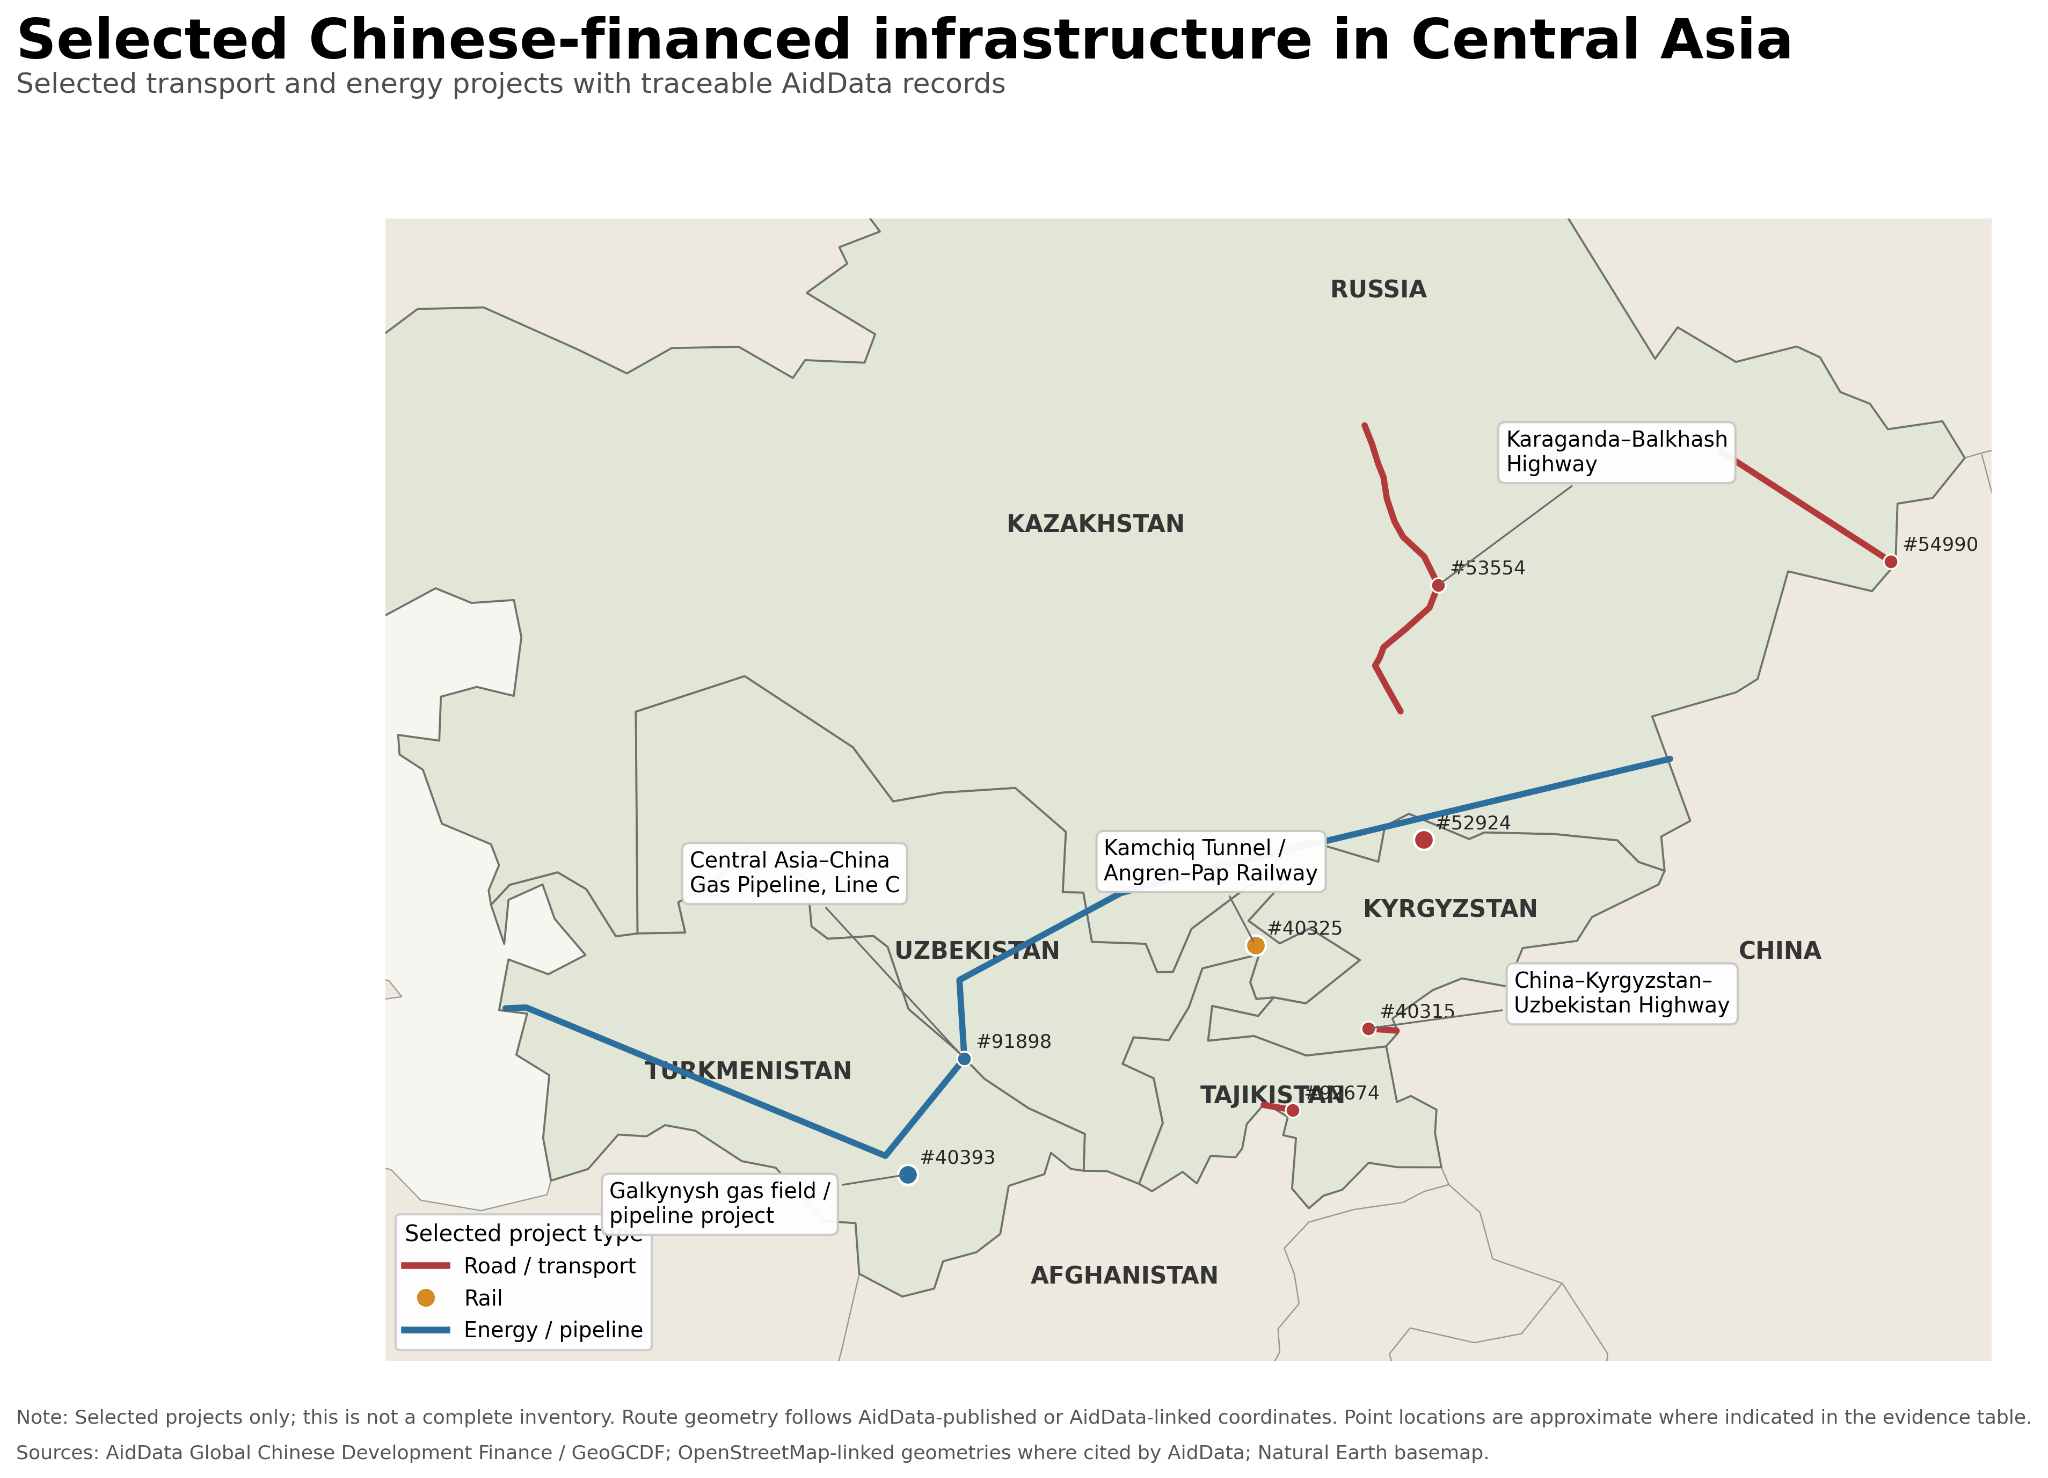
Figure 2: Selected Chinese-financed infrastructure projects in Central Asia. Source: AidData, Global Chinese Development Finance Dataset (Goodman et al. 2024); geographic boundaries from Natural Earth. Map and visualization by the author. Project locations are approximate and do not represent a comprehensive inventory of Chinese-financed infrastructure.
But this is only one map.
Change the Dataset, Change the Story
If economic relationships push eastward, other influences will continue to push north. Russia remains deeply embedded in Central Asia through relationships that cannot merely be represented by investment totals alone.
Migration is one of the clearest examples. World Bank data show just how significant remittances remain for several Central Asian economies. In 2024, personal remittances were equivalent to approximately 48 percent of GDP in Tajikistan and 27 percent in Kyrgyzstan. Uzbekistan’s figure was about 14 percent (World Bank Group 2024). Russia remains an important destination for Central Asian migrant workers, meaning that the movement of people and money creates a very different geography of regional dependence from the one produced by Chinese trade statistics (The Times of Central Asia 2026).
Security
Kazakhstan, Kyrgyzstan and Tajikistan remain members of the Russia-led Collective Security Treaty Organization (Collective Security Treaty 2021). Russia also retains significant military relationships and infrastructure in the region. Decades of Soviet integration have left other countries, regardless of how big they get, dependent on their transportation, linguistic, institutional and economic networks (Rutland 2023). Put these relationships on top of each other, then on top of our neat little map of expanding Chinese influence, it becomes even harder to interpret.
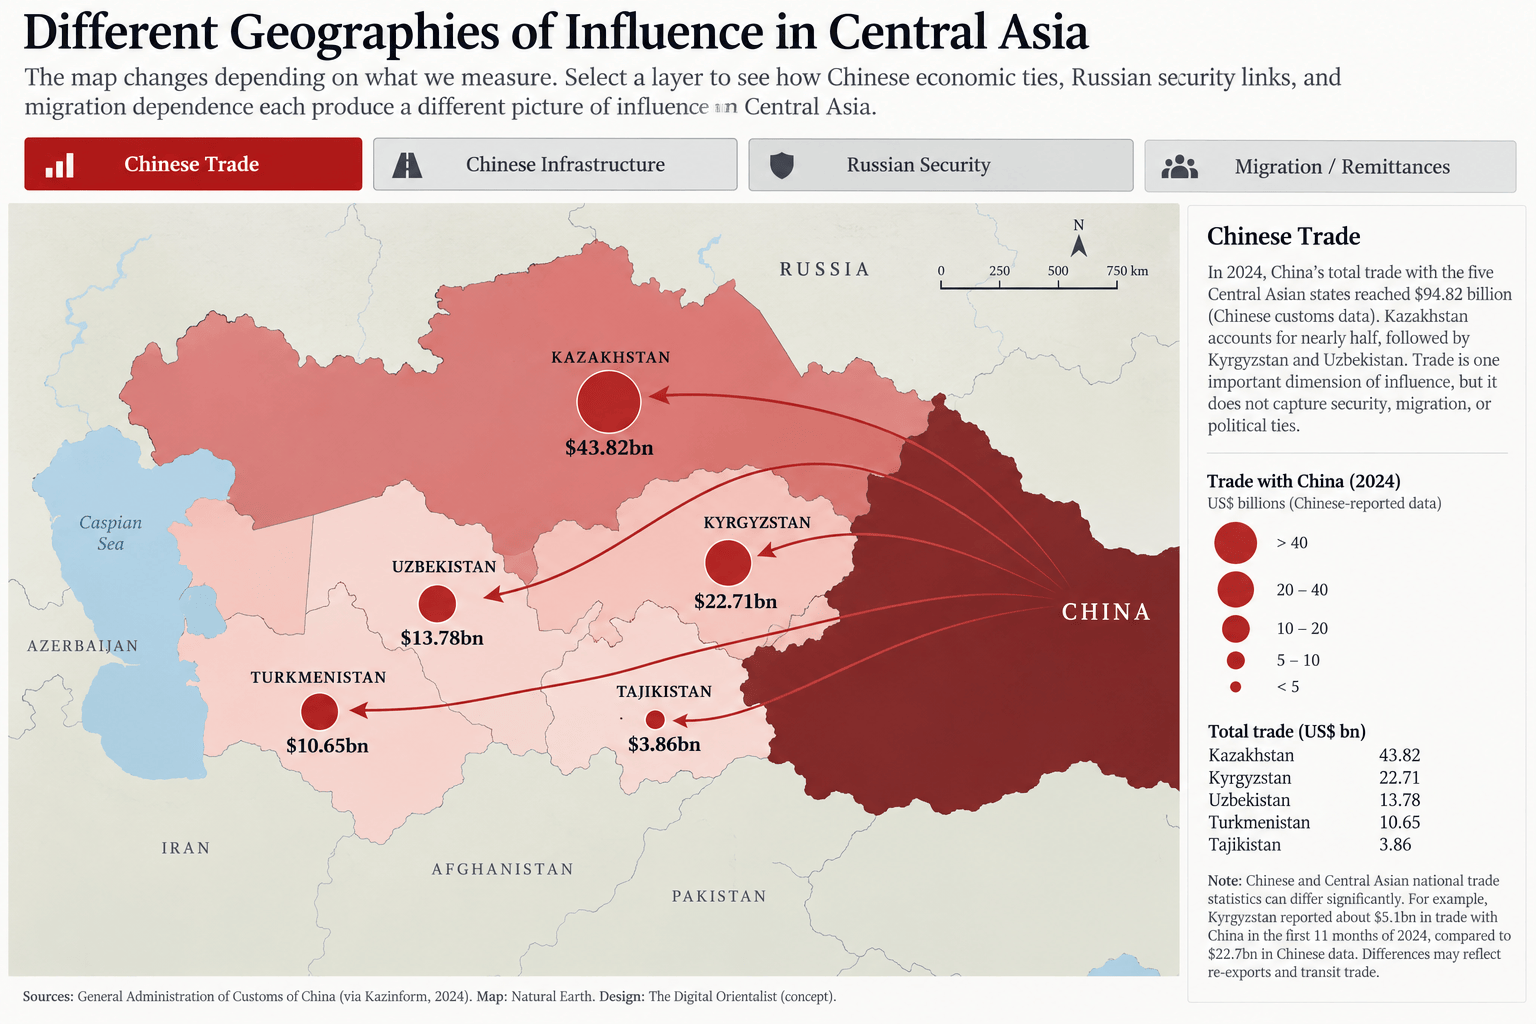
Figure 3: Different geographies of influence in Central Asia. Sources: General Administration of Customs of China (2024 bilateral trade data); AidData, Global Chinese Development Finance Dataset (Goodman et al. 2024); additional security and migration data sources as identified in the corresponding visualization layers; geographic boundaries from Natural Earth. Interactive visualization by the author.
This is the visualization I find most interesting, because it exposes a foundational problem. A researcher could construct a map demonstrating China’s growing dominance in Central Asia and be completely accurate in their own right. Another could construct one emphasizing the region’s continued dependence on Russia and they would also be completely correct. But neither necessarily captures influence. Their choice of data has captured only part of the picture.
Central Asia is Not an Empty Chessboard
There is another danger in visualizing the region primarily through Moscow and Beijing; it can unintentionally reproduce the idea of Central Asia as a space upon which greater powers act. Central Asian governments have their own agency and their own borders. Kazakhstan, Uzbekistan and their neighbors have increasingly pursued multi-vector foreign policies, developing relationships not only with Russia and China but also with the European Union, Türkiye, Gulf states, the United States and others (Yakobashvili 2026). Russia’s invasion of Ukraine accelerated interest in alternative transport networks, including the Trans-Caspian or “Middle Corridor,” connecting Central Asia with the South Caucasus and Europe while bypassing Russia (Eldem 2022).
From this angle, expanding ties with China doesn’t necessarily demonstrate a geopolitical pivot from Moscow to Beijing, but rather an attempt by Central Asian states to reduce dependence on any single external power. This distinction matters. If Kazakhstan expands rail connections with China while simultaneously developing Trans-Caspian routes toward Europe, the story may no longer be which great power is “winning”, but rather it would show Kazakhstan’s attempt to create more options for itself. Mapping connections rather than allegiances detangles our map, making it much easier to see.
What Digital Methods Reveal—and What They Don’t
There is something satisfying about turning geopolitics into a map. Messy political relationships become points, lines and colours that seemingly unlocks where power lies. But visual clarity can also create false narratives. Trade volumes measure trade, not political loyalty. A Chinese-financed railway demonstrates an economic relationship, but it does not tell us how local communities perceive China. Membership in a Russian-led security organization does not mean that a government automatically aligns with Moscow on every foreign-policy question. Remittance dependence tells us something different yet again.
This is why mapping Russian and Chinese involvement in Central Asia is useful even when it fails to produce a definitive answer, because it paints us a bigger picture. The contradictions between the maps are one of the findings of this research in and of itself. China’s economic footprint has expanded dramatically, while Russia remains embedded through migration, security, infrastructure and historical relationships. At the same time, Central Asian states are actively building relationships that complicate both spheres of influence.
Digital humanities allows us to find something more interesting than just a scoreboard of Russian versus Chinese power. It allows us to separate different kinds of relationships, layer them spatially and examine where they overlap…or fail to. The result is less tidy than the familiar story of one great power replacing another, but it’s a more honest one. And the same open-source methods used to map geopolitical influence raises another question: what happens when we use digital evidence to map power inside Central Asian states themselves?
In my next post, I will turn from external influence to the threat from within, digital authoritarianism and surveillance technologies.
References
André Algermißen, “Central Asia between Russia, China, and the West,” International Reports, Konrad-Adenauer-Stiftung, September 10, 2026.
Farkhod Aminjonov, “Central Asia-China Gas Pipeline (Line D) Spanning from Turkmenistan to Basic Information Project Outline / BRI – The People’s Map of Global China,” The People’s Map of Global China, April 2021.
Collective Security Treaty Organization, “History of Creation, Fundamentals of Activity, Organizational Structure,” Collective Security Treaty Organization, 2021.
Tuba Eldem, “Russia’s War on Ukraine and the Rise of the Middle Corridor as a Third Vector of Eurasian Connectivity: Connecting Europe and Asia via Central Asia, the Caucasus, and Turkey,” SWP Comment 2022/C 64 (Stiftung Wissenschaft und Politik, 2022).
Samuel Goodman, Sheng Zhang, Ammar A. Malik, Bradley C. Parks, and Jason Hall, “AidData’s Geospatial Global Chinese Development Finance Dataset,” Scientific Data 11 (2024): 529. DOI: 10.1038/s41597-024-03341-w.
Maximilian Hess, “Russia and China in Central Asia: Potential for Direct Competition,” Foreign Policy Research Institute, April 30, 2024.
Jennifer Hillman and David Sacks, China’s Belt and Road: Implications for the United States, Independent Task Force Report No. 79 (Council on Foreign Relations, 2021).
Shabir Ahmad Khan, “Trans-Regional Integration and Connectivity in Central Asia: Strategies of Russia, China and European Union,” Economic Diplomacy 3, No. 1 (2025): 61–73.
Djoomart Otorbaev, “China-Central Asia Collaboration a Necessity,” China Daily, June 16, 2025.
Peter Rutland, “Thirty Years of Nation-Building in the Post-Soviet States,” Nationalities Papers 51, No. 1 (2023).
The Times of Central Asia, “Central Asian Labor Migration Shifts as Russia Loses Some of Its Pull,” The Times of Central Asia, July 1, 2026.
World Bank, “Personal Remittances, Received (% of GDP) – Uzbekistan,” World Development Indicators, 2024.
Temuri Yakobashvili, “A New Race in the Post-Soviet Space,” Geopolitics, June 22, 2026.
AI Disclosure: Claude was used to assist with refining data visualizations and to improve grammar. The author reviewed, edited and validated all assisted output against the original sources and datasets.

