
This post continues my series on using the New Testament Virtual Manuscript Room (NTVMR) for researching and transcribing Manuscripts of the Greek New Testament. In the first post, I described how to create an account, find manuscripts within the NTVMR, and discover whether better images are available. In the second post, I showed how to index a manuscript, use the transcription editor, and shared some resources to aid in deciphering ligatures for minuscule scripts.
Once you have created a transcription of a manuscript, what can you do with it? This post will explore some initial ways to analyze the transcriptions made, whereas future posts will develop, leveraging even more information from your transcriptions. First and foremost, how do you access your transcription? As far as I can tell, there is no easy way to download your transcription, like clicking a button. However, in Troy Griffith’s dissertation on the creation of the NTVMR, chapter five covers the API of the website. The URL link to access the API is http://ntvmr.uni-muenster.de/community/vmr/api.1 This site can also be found by googling “ntvmr api”. The site you reach should show a list of things you can access via the API.
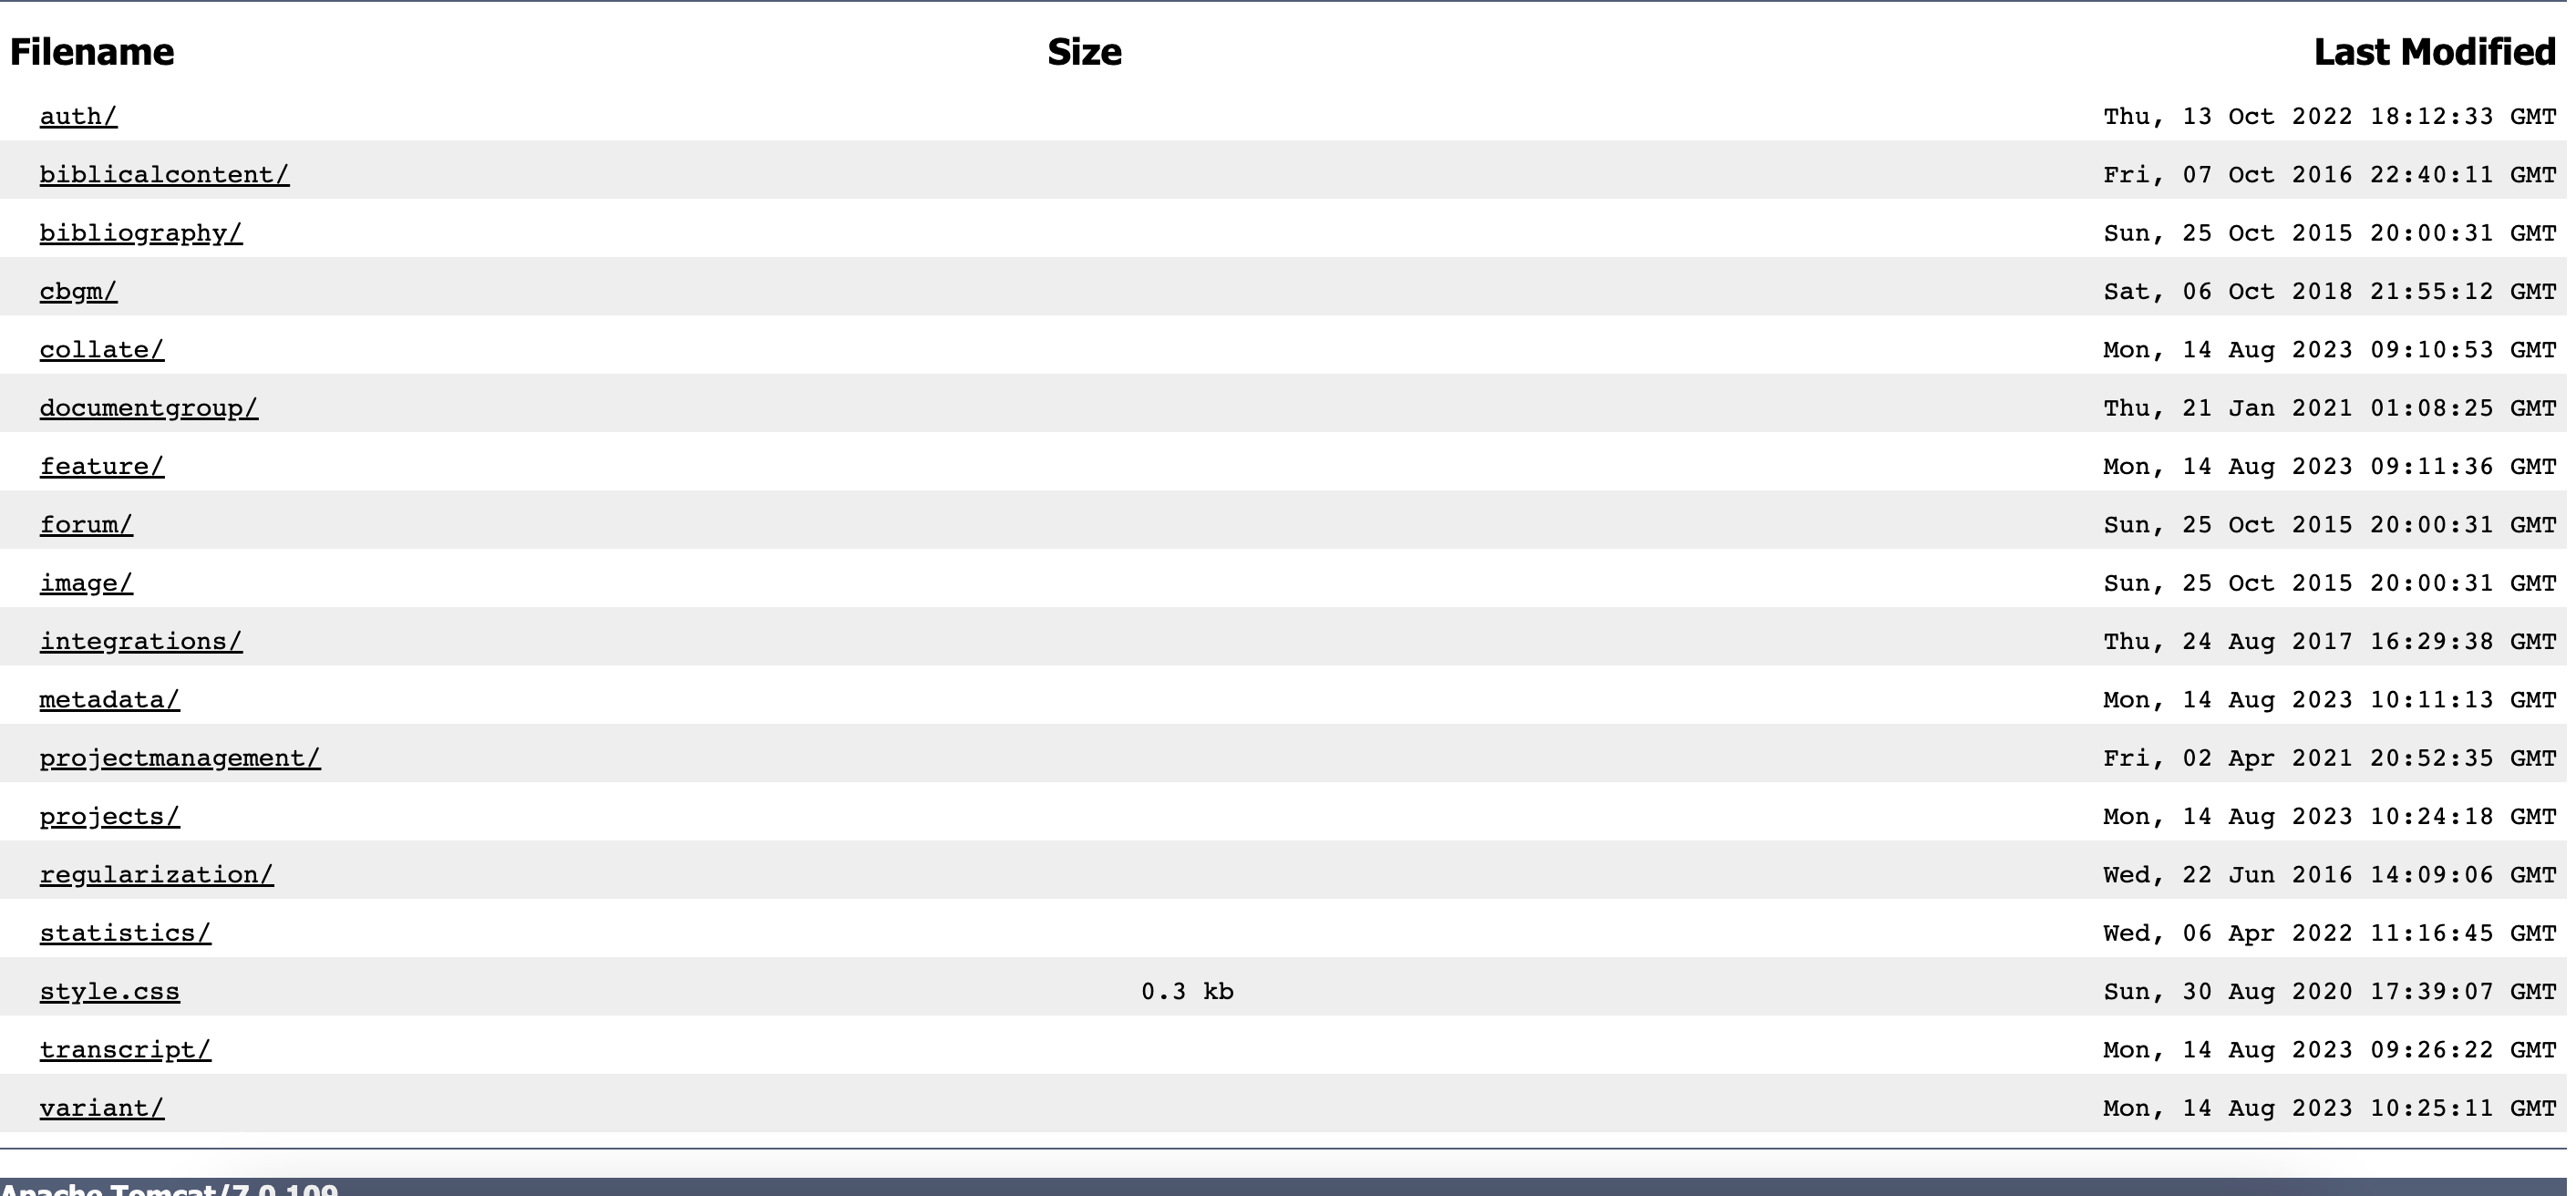
To access the transcription, click “transcript/”; click “get/” on the next page. The next page will show a list of options you can type into the URL to access different things, along with a sample URL at the bottom.
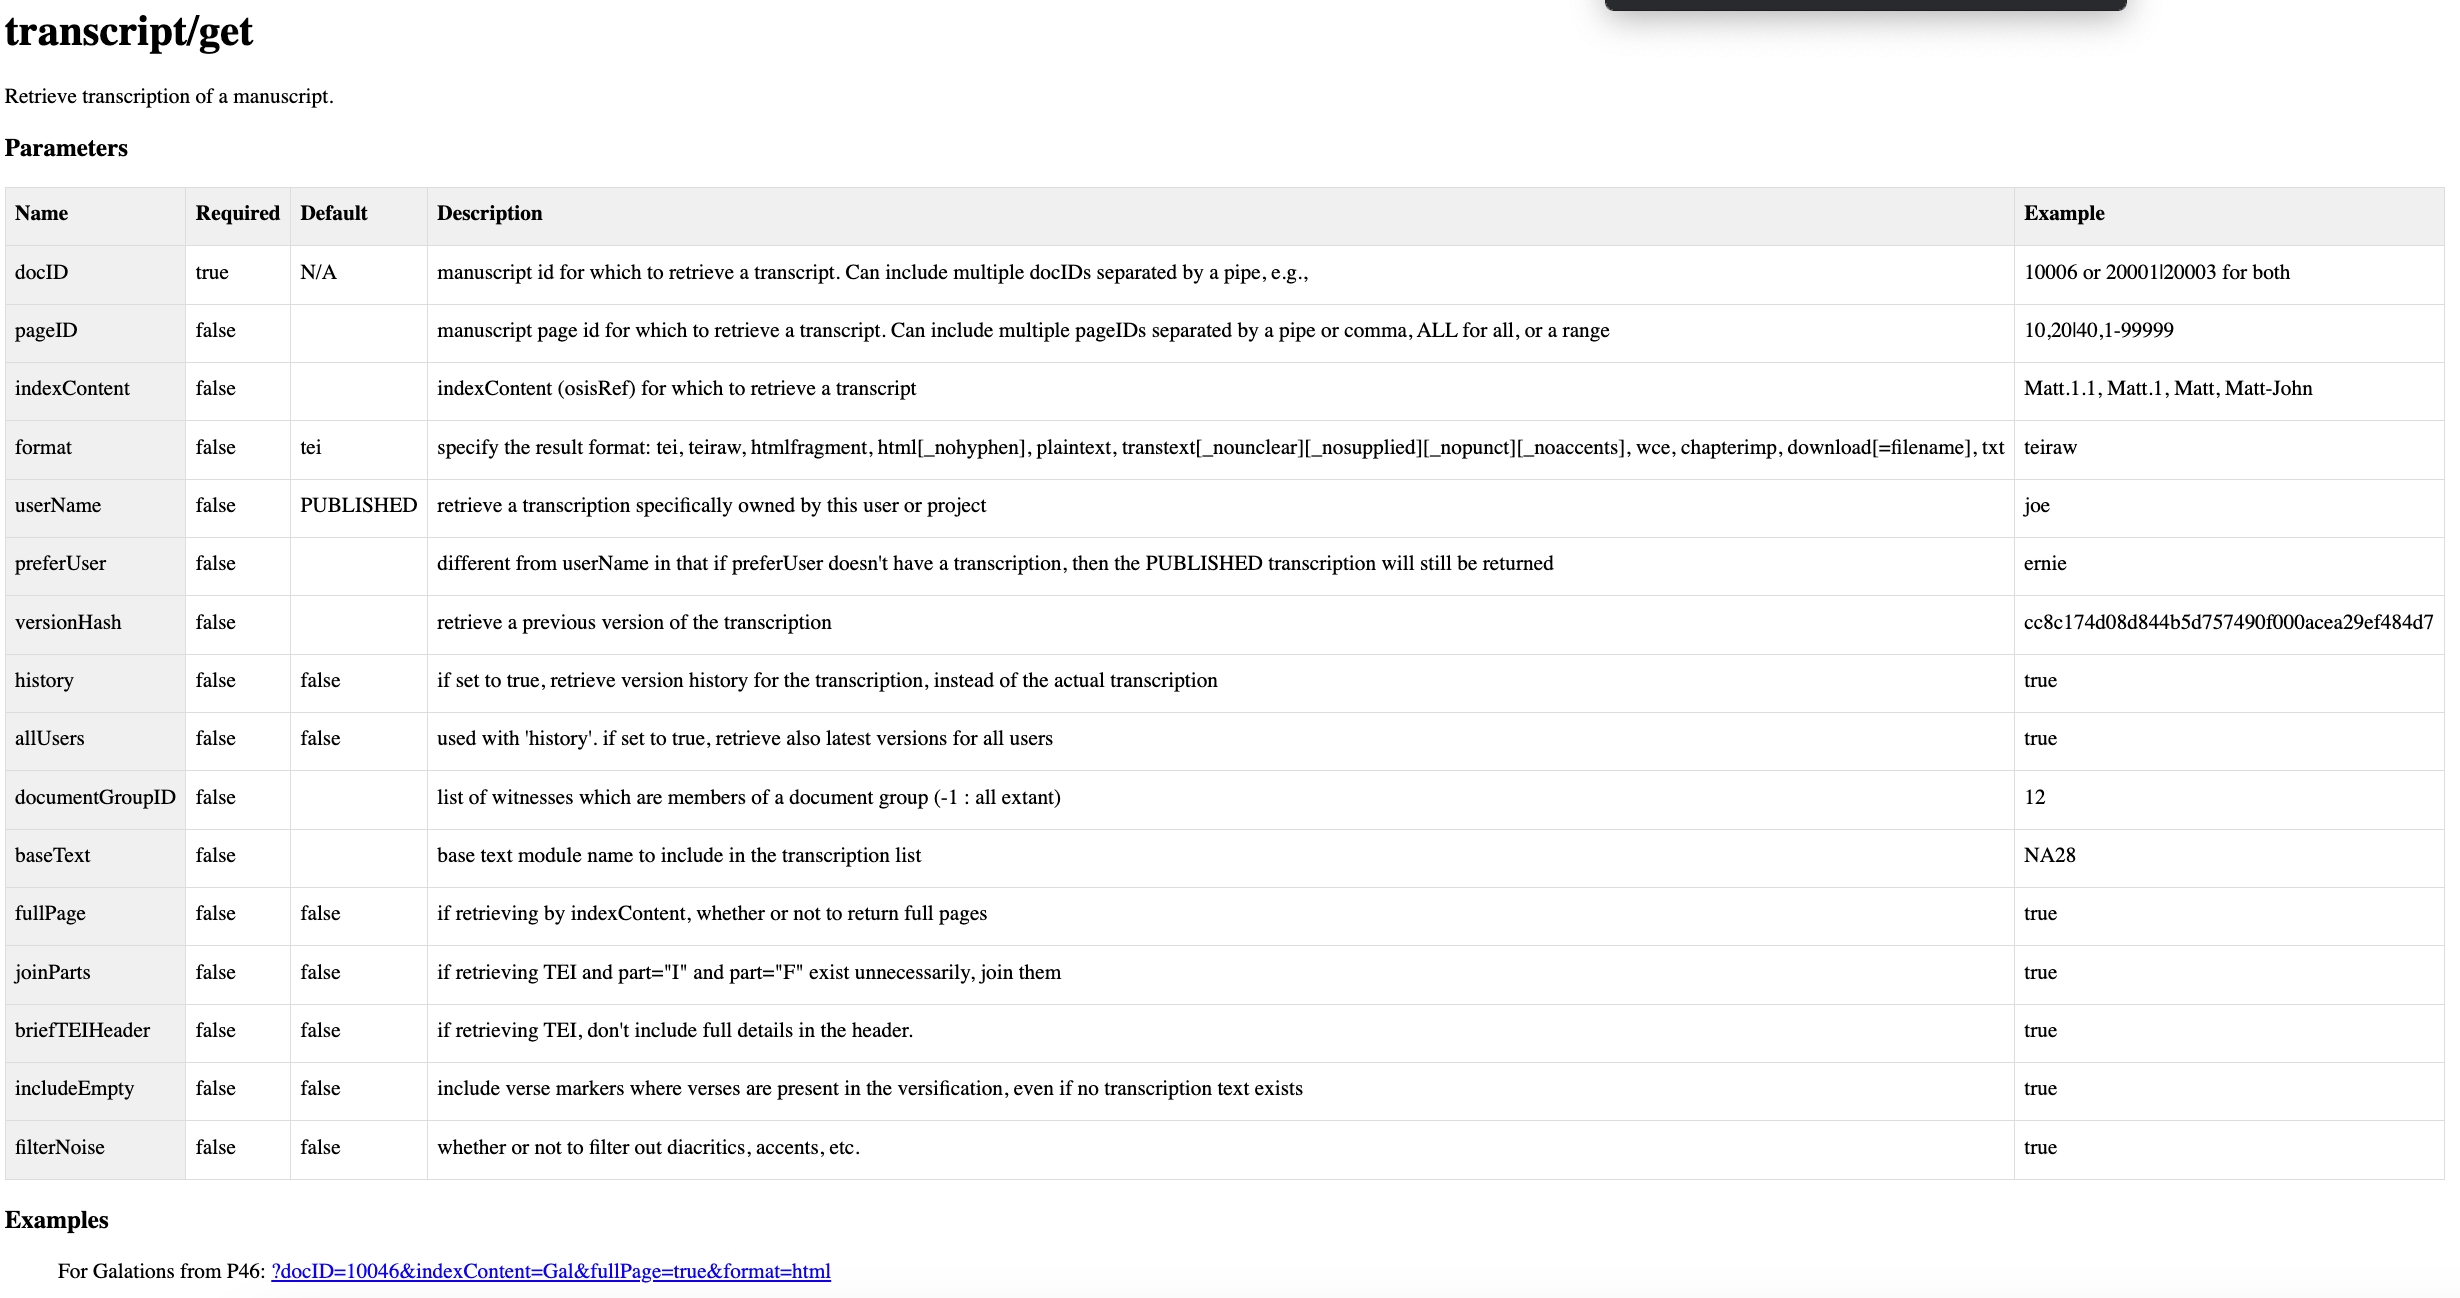
To illustrate this process, I’ll use the example we used in the last post, 2 Timothy, in manuscript 31848. I copied and pasted the example URL from the API and changed some of the information as well as added options, resulting in http://ntvmr.uni-muenster.de/community/vmr/api/transcript/get/?docID=31848&indexContent=2Timl&fullPage=true&userName=zachb&format=teiraw. Notice for the format section I chose “teiraw”. I could have selected HTML, which would have resulted in a nice-looking display of my transcription that looks like what I saw in the transcription editor. However, for the type of analysis I want to do in this post, it is important that I choose “teiraw”. Copy all the text that appears and paste it into a plain text file or in a text editor like VSCode and save the file with the extension .XML.
Now that we have downloaded our transcription let’s look at this file. I mentioned in my last post that the Transcription editor was a WYSIWYG (What you see is what you get) editor that abstracts away what is really happening. By transcribing in this editor, you make a TEI-compliant XML transcription of the manuscript. If you are unfamiliar with TEI (Text Encoding Initiative), more information can be found on their website, which is worth becoming familiar with.
If I open the XML file of my transcription that I downloaded on my computer, the transcription looks like this.
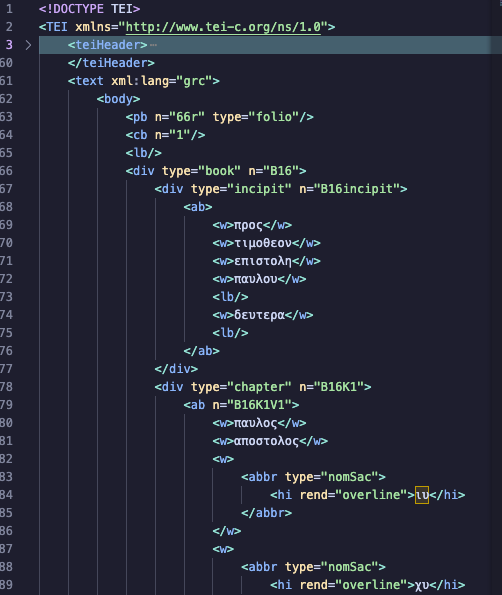
Note that I am using the text editor VSCode, so everything is color-coded to distinguish the different elements visually. If you open up the XML in a simple app like TextEdit for Mac or Notepad for Windows, the file will just be black and white. Basically, everything about the manuscript and its text is tagged in a machine-readable way. Because a machine (computer) can read it, you can do some interesting analysis on the transcription.
David Parker provides some examples of the statistical description needed for a manuscript study, such as the number of columns of writing, the number of lines in a column, the width of the column, etc. Parker also mentions that these measurements need to be taken at several places in the manuscript at random to get a good sampling.2 However, our transcription tags pages, columns, lines, words, etc. Why spend time sampling pages for this information when the computer could be leveraged to extract the information for the whole transcription?
I used the Python programming language and a Jupyter Notebook to demonstrate this. I chose Python because of its simple syntax and vast Library. Jupyter Notebook is an excellent tool for writing Python code that can be run in individual blocks and mix blocks of markdown text with your Python code blocks. A Jupyter Notebook allows me to document what I am doing at each stage of my code, break the problem into smaller pieces, and run those pieces a block at a time while I figure out what I am doing. I am completely self-taught with Python, so I find the Jupyter Notebook approach very helpful as I explore my problem. For those without experience with Jupyter Notebook, Google has an alternative called Colab. Colab has no setup that a Jupyter Notebook requires; these notebooks are saved in your Google Drive. I like coding in Visual Studio Code Editor, so I use Jupyter Notebook; however, Colab is also a great choice.
For the sake of brevity, I utilized Python, a Jupyter Notebook, and the Python libraries lxml and Pandas to process a complete transcription of 2 Timothy I did in GA 1848. I iterated through the XML tree and kept running counts of different tags representing different aspects of the manuscript. These counts were stored in a Python dictionary that I converted to a Pandas Dataframe. The data could be structured in any way that makes sense to you, but I created a dataframe where each row in the table represented one line in the manuscript. I plan to explain the details of this process in a subsequent post.

This structure allows enough granularity to quickly identify where corrections and Nomina Sacra (abbreviations) are and can also be queried for statistical information. For instance, I create a smaller dataframe containing every line in the manuscript that includes corrections.
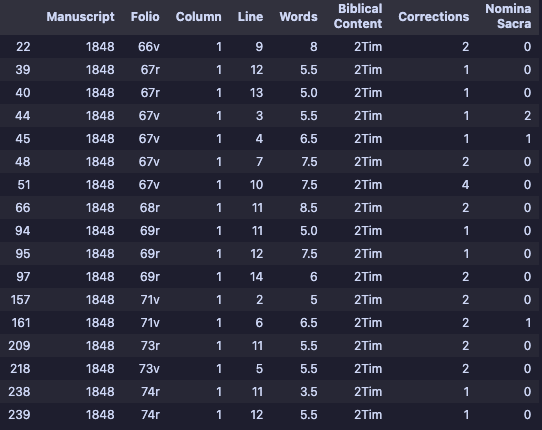
There are twenty-eight corrections in 2 Timothy in this manuscript. I can easily reference each correction to its corresponding folio, column, and line number if I want to study these corrections in the manuscript further. I could do the same for every Nomina Sacra.
By querying the original dataframe, I gathered some of the data Parker mentions and more. I see that 2 Timothy makes up eighteen folios of this manuscript. The total number of words in 2 Timothy for this manuscript is 1299. In comparison, 2 Timothy in Nestle Aland28 edition has 1241 words.3 The average words per folio of 2 Timothy is 72.2. This manuscript has 250 lines of text for 2 Timothy, with an average of 13.8 lines per folio. The average number of words per line is 5.2, and the longest line contains 9.5 words (some words are broken up across two lines, so I count these as half a word on each line). The longest line is almost double the length of the average. If I wanted to double-check the manuscript and see if this line was written longer, messing up the width of the column, the dataframe tells me that it’s located on folio 68 verso on line one (there is only one column of text throughout the whole manuscript).
The beauty of using Python to read and analyze the XML transcription is that you can customize your code to look for anything you want. Writing my code to produce a Dataframe of this structure made the most sense to me, but the code could easily be rewritten to display data about your transcription in many ways. In my next post, I will demonstrate more thoroughly demonstrate how I accomplished the analysis using Python.
- Griffitts, Troy Andrew. “Software for the Collaborative Editing of the Greek New Testament.” University of Birmingham, 2017, 259. ↩︎
- Parker, D. C. An Introduction to the New Testament Manuscripts and Their Texts. Cambridge, UK ; New York: Cambridge University Press, 2008, 91. ↩︎
- I pulled this data from Accordance Bible Software. ↩︎

3 thoughts on “A Guide for Using the New Testament Virtual Manuscript Room (Part 3)”