
This post has been contributed by Emre Amasyali. Information about the author is included at the end of the post.
In a previous piece in the Digital Orientalist, Giulia Buriola went over geo-referencing examples in QGIS. Here I would like to introduce readers to another common geographic analysis software they might encounter on the market: ArcGIS, and show how this software might be applied to social scientific historical research. Readers may be familiar with this software from Ahmet Yusuf Yuksek’s recent post entitled “Simple Map-Making with ArcGIS Online.” Many of the principles presented here can also be applied to QGIS and other GIS software. Although ArcMap is a paid software, some universities may offer access to it.
The exercise I will introduce in this post is slightly longer than usual and so it will be published in two-parts. The goal of Part 1 is to be become more familiar with geo-referencing a digitized image (i.e. a historical map) and drawing shapefiles in ArcGIS. Part 2 will continue this exercise by demonstrating how you can link historical census information to these polygons and visualize your data.
Step 1: Digitizing and Geo-referencing
First things first, some terms and preparation:
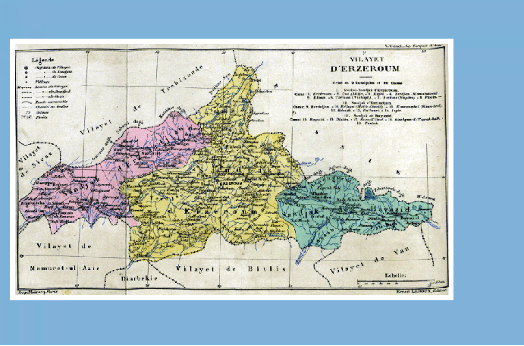
- Digitizing is the tracing of object boundaries or areas into computer-readable formats. By scanning maps into image formats such as .tif, .jpeg, .png, we can digitize them for GIS use. For this exercise, I will be using an 1890–95 map of Erzurum Province of the Ottoman Empire drawn by French Geographer Vital Cuinet. The map was extracted from Cuinet’s well-known work La Turquie d’Asie, Géographie Administrative as a .jpeg file.
- Geo-referencing is the process of ascribing geographic information to an image that does not contain any such information. Because our .jpeg file was taken out of a book, it contains no geographic information, we must therefore geo-reference it to be able to interact with it in ArcGIS.
- At this point we can go ahead and launch ArcGIS. Before we start the exercise, it is important that we link our project folder to ArcGIS. Folders on your computer are revealed by clicking the catalogue icon (seen below). Click “Connect Folder” and choose the folder that you are using for this project (keep all your files here). This will make it easier to drag, drop and save files connected to the project. Note that once you are in ArcGIS, files must be managed (renamed, deleted, etc.) through the ‘Catalog’ window.

- It is also helpful to load a Basemap, as this not only allows us to see where our data is located, but (if added first) also defines a projection system for the project; to add a basemap click on the dropdown arrow next to “Add Data” icon (seen below) → Add Basemap → Any option.

Now we are ready to add our (digitized) historical map. As mentioned above, we must geo-reference it. For most historical maps, you are most likely to encounter this issue. If we enter our digitized map in ArcGIS (simply click catalogue, find your connected folder and drag-drop the digitized image to the center of the screen, it should now appear in the “Table of Contents”), we will get the following error message:
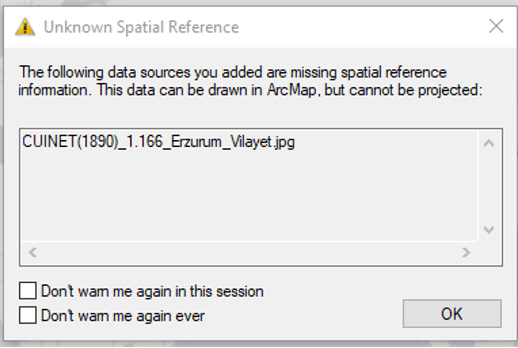
And if we go ahead and ignore the alert by clicking ok, we will see that our map is located somewhere in the middle of the ocean:
Clearly this is not correct. To ground the digital object to real world locations, we need to add ‘control points’ (also called ‘tie points’) in ArcGIS. The number of control points we need will depend upon the size of our digitized image. It is best practice to add between 10-30 control points to a digital object or area.
Control points have to be locations that we know the exact geographic coordinates to. Accordingly, I select 17 major cities charted in the map:
- Erzeroum (Erzurum),
- Kemah,
- Izpir (İspir),
- Kouroutehai (Kuruçay),
- Refahiye,
- Baibourt (Bayburt),
- Mamakatoun (Tercan),
- Ilidja (Ilıca),
- Kighi (Kiğı),
- Khinis (Hınıs),
- Hasankale (Pasinler),
- Erzindjan (Erzincan),
- Nikagh (Tortumkale),
- Toutak (Tutak),
- Karakilise (Ağrı),
- Diadin (Diyadin),
- Bayazid (Doğubayazıt).
You will notice that most of the names in the above list and on the map have different names. This is because the names of these locations were transliterated or have changed since the creation of the map. This is a common problem in Historical GIS research. For this reason, it is best practice to consult historical gazetteers that allow you to trace the toponymical evaluation of each location. For Ottoman place names I consult Tahir Sezen’s Osmanlı Yer Adları (Ottoman Toponyms).
Next, I use google maps to find the exact coordinates of each town. (If you are dealing with a larger geographic area there are also batch geocode options online). Alternatively, I can also use the basemap to link each of these historic locations to modern cities.
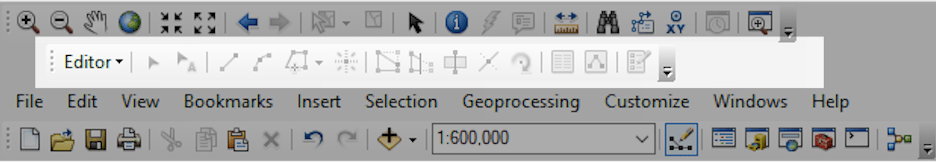
To add a control point in ArcGIS, you must make sure that Customize → Toolbars → Geo-referencing is selected. Once your geo-referencing tab is visible, make sure your digitized map is selected from the drop down, and click the “add control points button” (seen below).

Next, left-click a location on your historical map that you want to geocode. If you know the exact latitude and longitude of the location, you can right click immediately and enter this information. Alternatively, you can select the ‘true location’ by using your base map. Similar to entering coordinates, right click on the city on the historical map and right click again on the true location on the basemap. Repeat this process for all of the 17 points and make sure your control points are evenly spread (see below).

It is important to remember that adding more control points does not always equal better. An excessive amount of control points can result in artifacting, i.e. the distortion of the digital object or area due to over-correction. As you become more proficient in geographic analysis software it is worthwhile to check the residual distance error of your georeferenced imaged as this will tell you how much error was involved in your geo-referencing process. As you add your control points, you will notice that the historic map will move closer to its true location, and look something like this:

Another important point to remember is that these maps were created before satellite imagery. While cartography had advanced considerably by the second half of the nineteenth century, you will never get a perfect match between a historical map and your basemap.
Step 2: Creating Shapefiles for Administrative Units
Now that we have our image properly geo-referenced, we can move to recording information contained in the map. More specifically, we will be creating shapefiles for each of the districts or kazas contained within our map.
Contemporary administrative border shapefiles can usually be accessed online (e.g. https://www.diva-gis.org/gdata). There are also a number of projects that have produced valuable historical boundary files for certain countries (China, United Kingdom, United States, Russia). Unfortunately, there is no publicly available boundary files for the Ottoman Empire – hence, we have to manually trace the administrative borders contained in this map.
To do this, we click the catalog icon and find the folder we have our project files in. It might make sense to create a separate subfolder for your borders and categorize them through an upward hierarchy. Next, right click this folder → New → Shapefile…
Make sure to name your shapefile with sufficient information. For this project I will be using the naming convention “Vilayet(Province)_Sanjak(Subdivision)_Kaza(District)”. The first kaza I choose to trace is Kemah so I call it Erzurum_Erzincan_Kemah. Make sure “polygon” is selected under the “Feature Type” dropdown and define a spatial reference by clicking edit. The basemap was defined as WGS Web Mercator 1984, so I will stick to this. When you are done hit ok.
Our shapefile is created, yet we still need to draw it. To do this, make sure the editor tab is selected under Customize → Toolbars. Then click on the editor icon on the far left, and select start editing.
When you draw a polygon, you must double-check that the appropriate shapefile is selected (Editor → Editing Windows → Create Features → Shapefile). It is a common mistake to have the wrong shapefile selected; if you do this, the resulting image will be appended to the wrong shapefile (not a problem for now since we are creating our first polygon).
If you have gone through the correct motions, you will notice your cursor is now a “+” sign. This means you can start drawing. Select a point on the border of Kemah Kaza and start tracing by right-clicking multiple points on the border. When drawing shapefiles you cannot use your mouse to click and drag, thus rely on your arrow keys to navigate the image. When you are done drawing, hit F2 or right click “Finish Editing”. Then select Save Edits and click Finish Editing. The resulting image should look like this:

Repeat this process for all districts or kazas. In the end, my image should looked something like this:

At the end of this exercise we have managed to create geocoded shapefiles superimposed over our historical map. Unclick the layer containing the historical map and you will see that these drawings are independent of the original basemap we started the exercise with. This is an important step in incorporating historical information into ArcGIS and will be used as a launching pad for importing historical census data into ArcGIS in Part 2.
About the Author
Emre Amasyali is a PhD candidate at the Sociology Department at McGill University. Amasyali’s research examines topics of political sociology, comparative historical sociology and history and combines qualitative methods with statistical analysis, geospatial analysis, and archival research.
thanks this topic helpful about my paper.