
This is a guest post by Ann Marie Davis (The Ohio State University), Katherine Matsuura (Harvard University), and Yukari Sugiyama (Yale University)
Introduction
Finding unique research materials can often be challenging and time-consuming. By their very nature, rare texts, special collections, and archival papers are distinctive and thus not widely available. Most libraries and archives have significant holdings of special materials, but connecting these with specialized scholars is not always seamless. Even when librarians have the capacity to promote their materials online, their descriptions are not systematically available via Internet search engines or finding aids. On the flip side, even the best of researchers have to rely on word of mouth, professional connections, and years of field experience to locate and access the materials they need.
Our digital project, Notable Japanese Collections in North America (NJC), aims to simplify this process of discovery and access for researchers as well as curators and other information professionals. Launched in February 2022, the NJC offers an online database and visualization tool that helps identify, describe, locate, and promote rare or distinctive Japanese Studies collections. As our website grows, the ultimate aim of the project is to provide a comprehensive database that maps and describes all notable materials (including unprocessed or partially processed collections) in North America.

Project Collaborators and Rationale
Our core team consists of three information specialists in Japanese Studies: a digital scholarship librarian, an Area Studies librarian, and a metadata librarian from Harvard, The Ohio State, and Yale Universities respectively. Volunteering on the North American Coordinating Council on Japanese Library Resources (NCC), we created the NJC to fill a gap in library and digital resource services. General resources (e.g., print books and journals) are relatively easy to discover and access via union library catalogs. Most notably, WorldCat, connects the collections and services of over 10,000 libraries and research organizations worldwide, for example. When it comes to locating special, rare, or distinctive materials, however, there has been no major resource or collaborative network in our field that facilitates online discovery and access to materials held in North America.
Despite this gap, we observed model projects in other subject areas that were responding to the demand for stronger online search tools. Importantly, we drew inspiration from the Digital Collections for Chinese Studies, an open-access resource developed by Dr. Yan He, China Documentation Center Librarian, and Dr. Ann James, Data Science Librarian at George Washington University. Using ArcGIS Online, their project identifies and maps digital collections as well as archival materials, oral history, rare books, images, and datasets in Chinese Studies. Similarly, the Association of Jewish Libraries (AJL), the leading authority of Judaic librarianship, maintains the Jewish Collection Directory, which charts “both well-known and lesser-known Judaica collections around the world.” A related yet substantially larger-scale endeavor focusing on geospatial resources is the Big Ten Academic Alliance (BTAA) Geoportal, which facilitates access to GIS datasets, web services, and digitized historical maps.
In Japanese Studies, the idea of developing an online database of notable collections in North America was not new. In 2017, several of our colleagues active in a working group to promote cooperative collection development put out a call to the NCC as well as the Council on East Asian Libraries (CEAL) for participation in a brief survey gathering details about print, electronic, processed or unprocessed collections. Suggesting the diverse nature of such “notable collections,” they cited as examples the East Asia Image Collection at Lafayette College and the extensive collection of film-related materials, known as the Hashikura Collection (partially processed), at the University of California, Berkeley. Within two short months, their survey had garnered over seventy entries, creating a significant dataset and foundation for building a comprehensive list.
Defining Project Terms and Partnership
When our team first convened in March 2021, we discussed developing a web-based map that focused simply on digital collections. We quickly recognized, however, the value of our colleagues’ broader list of “notable collections.” Inspired by their foundational work, we approached them to discuss our interest in building a dashboard that would display their data with GIS mapping software and online visualization tools. We also proposed partnering with them to promote and build a more comprehensive list. Our colleagues graciously supported this plan and have since collaborated with us in collecting and sharing NJC data.
In our joint mission to expand the list, we now actively promote the NJC Survey, an online Google form where librarians and scholars are asked to enter details about notable collections, large or small, at their home institutions or other colleges and research repositories. By “Japanese,” we mean any collection that was primarily made in Japan, written or recorded in the Japanese vernacular, or related to the Japanese diaspora. Additionally, to maximize our network of discovery and access, we chose to define “Notable Collections” as any rare archival or special collection; unique or original dataset; collection of music, ephemera, or art; or online exhibits and digital archive projects. The NJC also includes individual heritage assets or objects (such as an ancient Buddhist scroll) that merit discovery by scholars and specialists.
Technical Decisions: Choosing Google Data Studio
The NJC is built on Google Data Studio, a free and interactive data visualization tool from Google products and internet services. Unlike similar tools that require a license fee (such as Tableau, Power BI, and ArcGIS), Google Data Studio is available free of charge to anyone who has a Google account.
While we chose this tool for its easy start-up cost and functionality, we found it was the right platform for our project for additional reasons. First, the tool’s sync, edit, and share features are indispensable for cross-institutional collaborations where various members need direct access to manage and maintain the site from different locations. Second, the ubiquity of Google products makes the transfer of control or ownership of project files relatively simple, as most colleagues already have Google accounts.
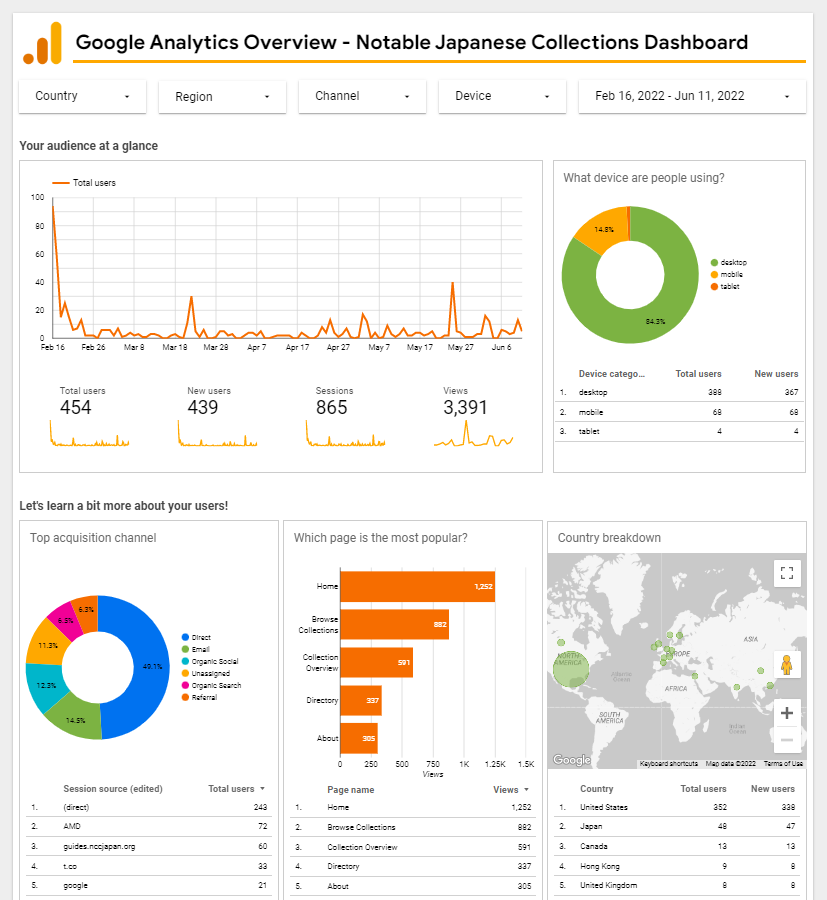
Third, given the close integration of Google tools, the Google Data Studio fits well with our Google-heavy workflow. Our data collection form is based on Google Forms, and therefore user responses are automatically stored in an integrated Google Sheets spreadsheet. We maintain a separate spreadsheet in Google Sheets that automatically pulls and organizes selected data from the response spreadsheet. This latter document serves in turn as the core data source for the NJC dashboard. Because these various Google tools are all synced together, our workflow is largely automated. Additionally, thanks to Google’s high level of integration, we have been able to embed a tracking ID for Google Analytics into our dashboard enabling us to measure and evaluate how anonymous users interact with the website’s features.
The Website at a Glance
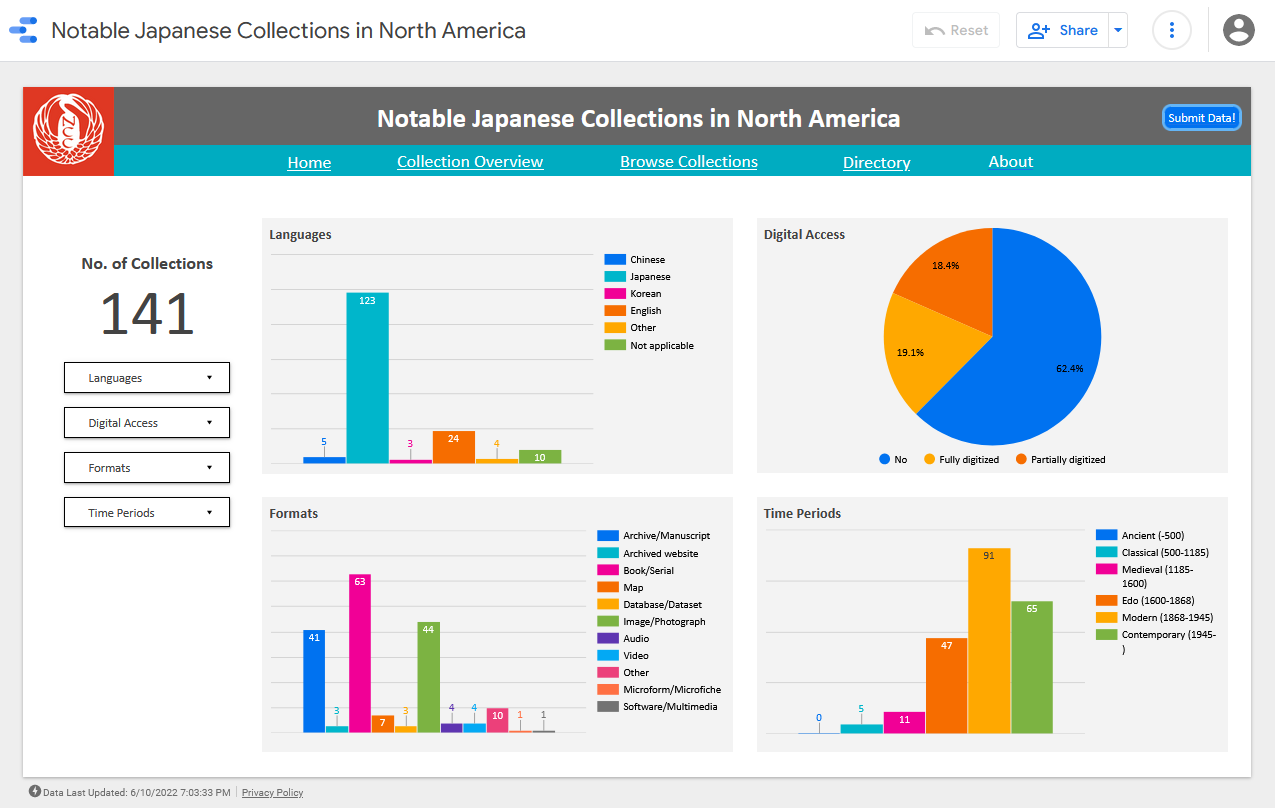
The NJC dashboard consists of five pages:
- The Home Page features a map that charts Japanese collections in North America and allows users to locate institutional holdings at a glance. When users hover their cursor over a red marker, a tooltip is displayed with a corresponding institution name, address, and related collections.
- The “Collection Overview” provides quick data visualizations of the types of library collections that are listed in the NJC database. Users can filter these collections by language, digital access, format, and time period.
- The “Browse Collections” expands on the details of the collections and allows users to filter the contents by institution names, formats, languages, time periods, and digital access. Keyword searches can be conducted in English, Japanese, Romanized Japanese, or any combination. The search function is case-insensitive (a=A) and diacritics-insensitive, specifically with macrons (Ā=A).
- The “Directory” provides the contact information for participating holding institutions, which are listed alphabetically.
- The “About” page includes a brief description of the project, a “how-to-use” guide, and project acknowledgments.
As we write this article in June 2022, the database has over 140 collections from national to academic libraries of all sizes in North America. According to our anonymous web traffic data collected through Google Analytics, the dashboard has been visited more than 860 times from 17 countries since its launch. The United States has the highest proportion of web traffic (76%), followed by Japan (12%), Canada (3%), Hong Kong (2%), the UK (2%), and Ireland (2%).
Project Challenges and Workarounds
Inevitably, every tool and platform has limitations, and every project must work within the boundaries of time, cost, capabilities, and the sheer messiness of data as it exists in the real world. In terms of the Notable Japanese Collections (NJC), a few of the limitations are relatively obvious, but in most cases, they remain largely hidden, and to the extent possible, workarounds were incorporated to shape user expectations.
Our greatest challenge was the flaw of the Data Studio map located on the landing page, and yet, this visualization tool remains without question one of the unique features of the dashboard. A running list of the map and other platform shortcomings includes:
- The current inability to use the map feature on mobile devices
- The current inability to add more than one hyperlink to any map call-out location
- The oversight in Google Data Studio in addressing issues of accessibility. For example, it is currently impossible to adjust font size or add alt text within the map and throughout the rest of the dashboard.
- The current inability to easily differentiate red markers that are in close proximity to each other. Despite the benefits of geolocation, users will find it difficult to ascertain separate call-out locations when they are located at different libraries at the same university or different institutions in the same city. At first glance, the red markers for each location will overlap unless the map is enlarged for full discoverability.
While each flaw presents a challenge, the larger conversation has centered on how to shape users’ expectations around these limitations. Given today’s on-demand access to media and full-text search options, a visitor to our site will likely click on the map and anticipate some type of virtual gateway to a multitude of collections. Realistically, the map will never be a digital portal to every collection, and instead should be understood as an interactive visualization of the sum of the collections themselves. Rather than create confusion, we chose to ignore the one-link option (available to map callouts in Google Data Studio) and focus instead on showcasing the comprehensive and complex nature of holdings within North America, albeit in a less interactive format than anticipated. In that sense, we tailored the map as a means to address and shape expectations from the initial point of entry.
In addition to the mapping tool, we naturally encountered a few technology challenges on the other pages of the dashboard. These include rigid platform features that force the filters’ category lists into alphabetical order or successive data sizes. For the most part, this is not especially problematic, but it prevents the chronologic display of time periods (e.g., classical, medieval, or modern). A bigger disappointment, however, has been the inability to embed the NJC dashboard in other professional websites. Although Google Data Studio offers an option to embed, this feature is not compatible with several components used in this project, such as the CSV filter and the rendering of collections in a card view. While these challenges have demanded our extra attention, we recognize that they may be temporary. Given the inevitability of new features and regular improvements, future technology upgrades on the Google platform will likely eliminate our concerns in these areas entirely.
Ultimately, the challenges that remain for the NJC are not those of technology. Instead, they are strategic questions and dilemmas centered on the changing nature of collections and the growing complexity of today’s data and materials. For example, what type of map location and visualization is needed for a collaborative digital collection that spans multiple North American universities? What if one or more of the collaborating partners is in Japan – would the collection still be considered “North American”? In that sense, there will always be new questions about how to highlight the materials that curators and archivists manage. As these matters continue to evolve, so too will the Notable Japanese Collections dashboard. It is a work in progress that is designed to be sustainable and simple to maintain for years to come. While the project will never truly be complete or finished, much like our own institutional collections, we will continue to refine, improve, and share it with the world.