
MapHub allows users to make either thematic or regional maps using Geographic Information Systems as an interactive map. It provides many features, such as navigating these web-based maps, defining certain features, and adding descriptions and images.
With interactive maps, users can create layers of information that are readily displayed or navigated with a single click. For example, many maps are being produced about the Covid-19 Pandemic and the course of the pandemic can be monitored worldwide. In this post, I introduce MapHub, one of the easiest-to-use applications among interactive map tools.
What is MapHub?
MapHub is a database that allows the creation of interactive maps by adding various data and tags. Researchers can add photos and organize items into groups. In addition, the data in these interactive maps can be imported or exported in GeoJSON, Shapefile, KML, GPX, or CSV formats.
One of the current examples of research done in Ottoman studies using MapHub is the Ottoman Population Atlas prepared by Tufan Kaya. Thanks to this map, the regions and peoples ruled by the Ottoman Empire according to the 1914 census can be examined. Another example is the Sakarya Cultural Inventory prepared by the Center for Ottoman Studies. This second map shows the historical buildings of Sakarya, Turkey, and various data related to these.
Here is another example.
How can you use MapHub?
First, it is necessary to register on the site. The registration process is easy and free; it should be noted that the only language available is English. Once you have registered, you are ready to make maps on MapHub! Using the free account comes with some limitations on MapHub’s features, an example being a limit of 100 coordinates for your map.

To create a map, start by visiting the homepage. You need to click on the “New Map” tab in the upper left corner. Here you can also explore various maps produced by other users in the Explore Maps section.
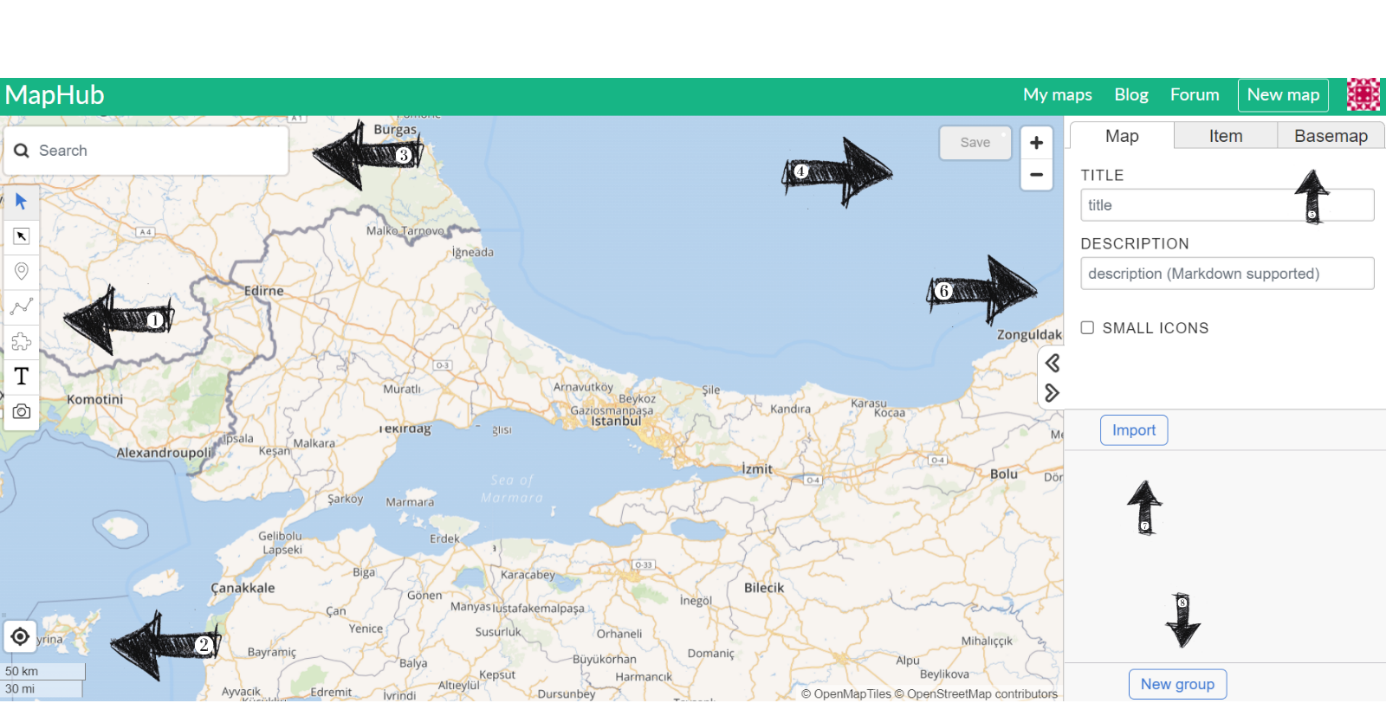
In the image above, I pointed at the tools that can be used for an interactive map on MapHub.
There are eight aspects to use and pay attention to in using this software.
1. Map Tools

1.1. Select: Used to create new items on the map.
1.2. Multi-Select: Used to create multiple items.
1.3. Point: Used to create locations by clicking on the map.
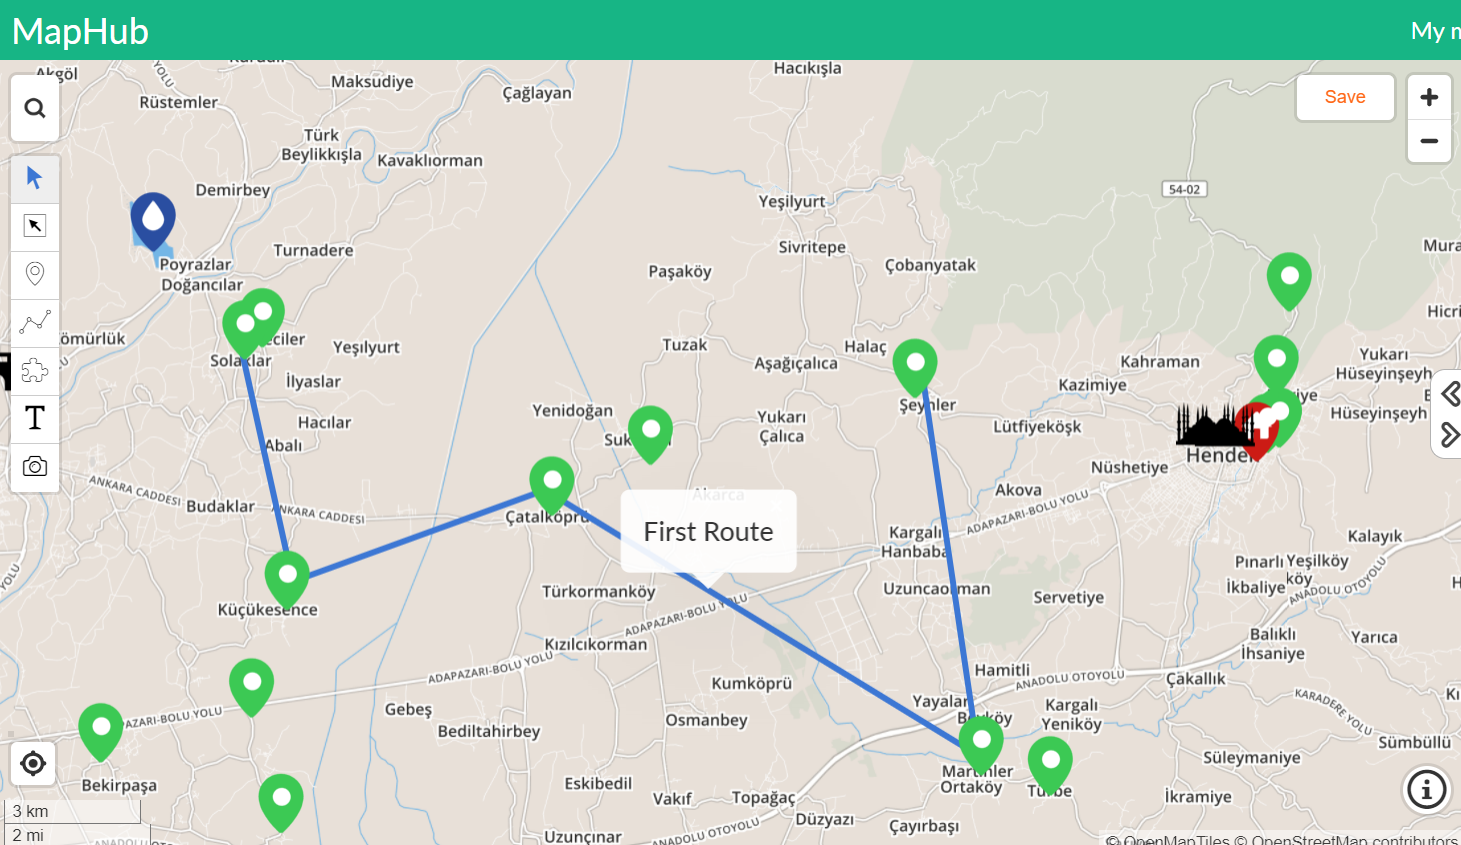
1.4. Line: Used to show itineraries, routes, etc., linearly.
Follow these steps to use the line tool:
- Start a line by clicking on the map.
- Add points by subsequent clicking.
- Finish the line by clicking on the last point or pressing the Enter or Esc key.
- Make the line closed by clicking on the starting point.
- Remove the last point by pressing the Backspace or Del key.
- Later, you can edit the line by clicking on
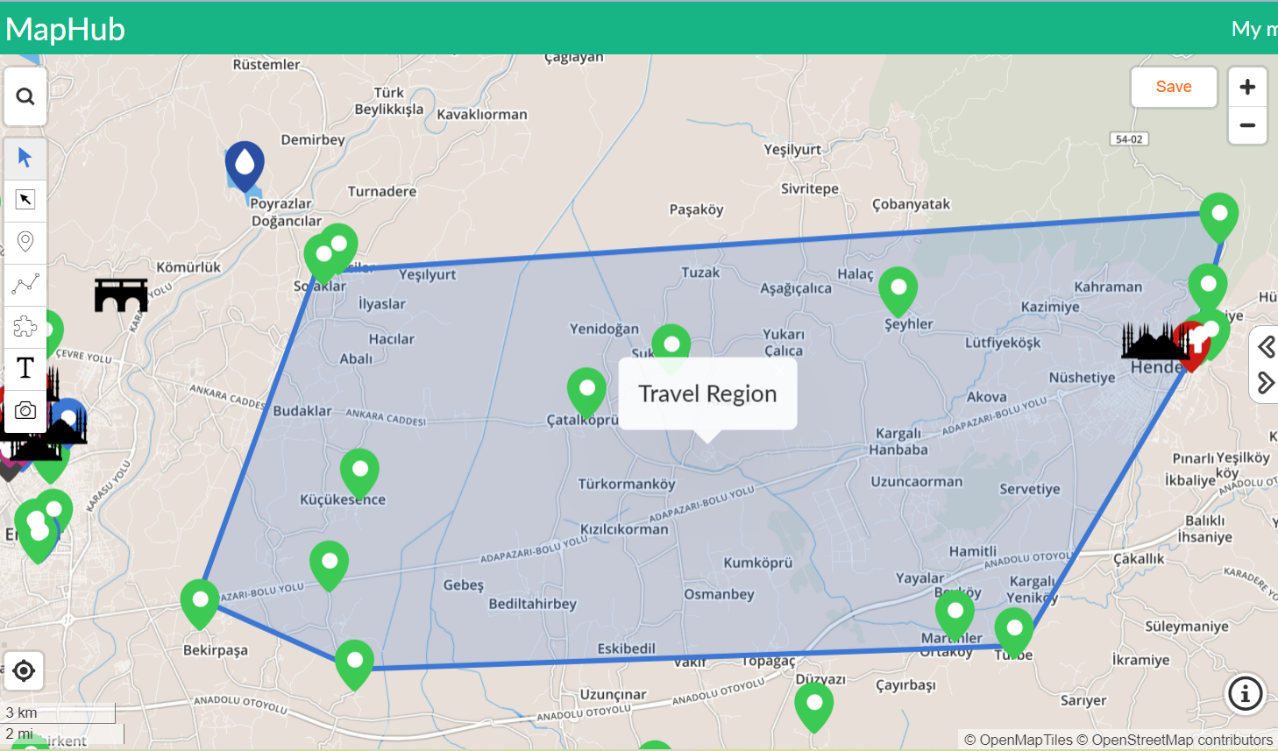
1.5. Polygon: Used to make a regional representation on your map
Follow these steps to use the Polygon:
- Start a polygon by clicking on the map.
- Add points by subsequent clicking.
- Finish the polygon by clicking on the last point, or by pressing the Enter or Esc key.
- Remove the last point by pressing the Backspace or Del key.
- Later, you can edit the line by clicking on
1.6. Label: Used to show labels on your map
- Place a label by clicking on the map.
- After placing it, you will be able to set the title here.
- Later, you can edit the line by clicking on

1.7. Image: Add JPGE or PNG format image on the map.

2. Scale
You can view the scale of all your maps to be prepared on MapHUB.
3. Adding Coordinates
MapHub assigns points to maps with coordinates.
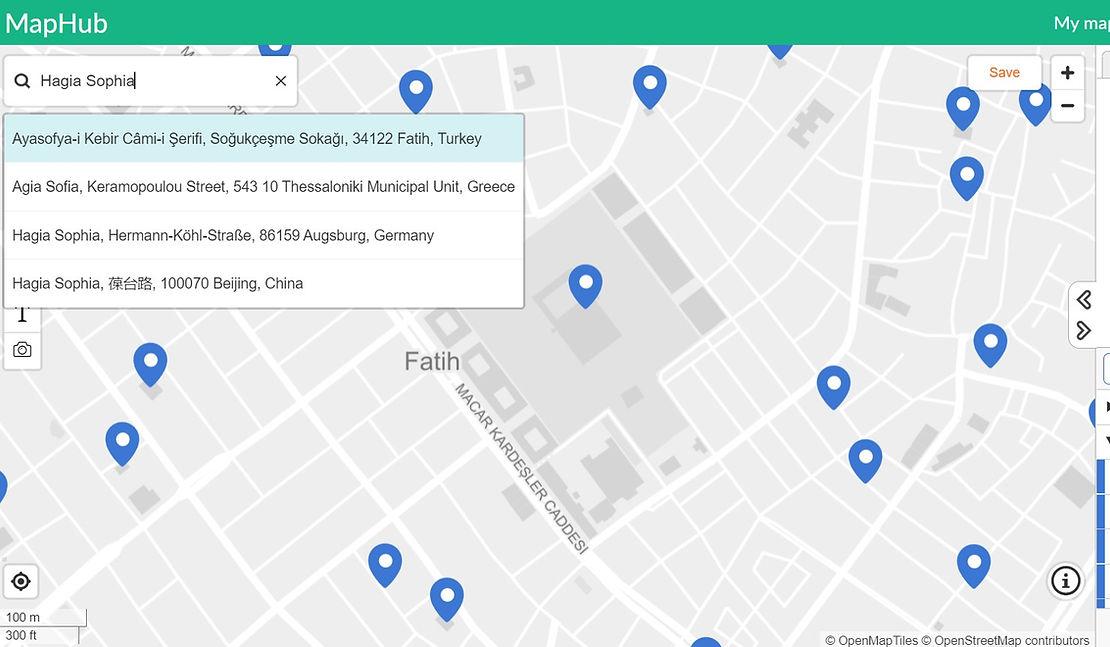
What should we do if we need help finding coordinates in the Search section?
To answer the question, we need to use Google Maps. If you encounter a place that cannot be found in the system when searching, you can find the coordinate of this place in Google Maps and add it to your map!
For example, let us find the coordinates of the Blue Mosque in Istanbul. First, search for the location’s name in Google Maps as shown below, then press Enter.

Right-click to copy the coordinate information at the top.
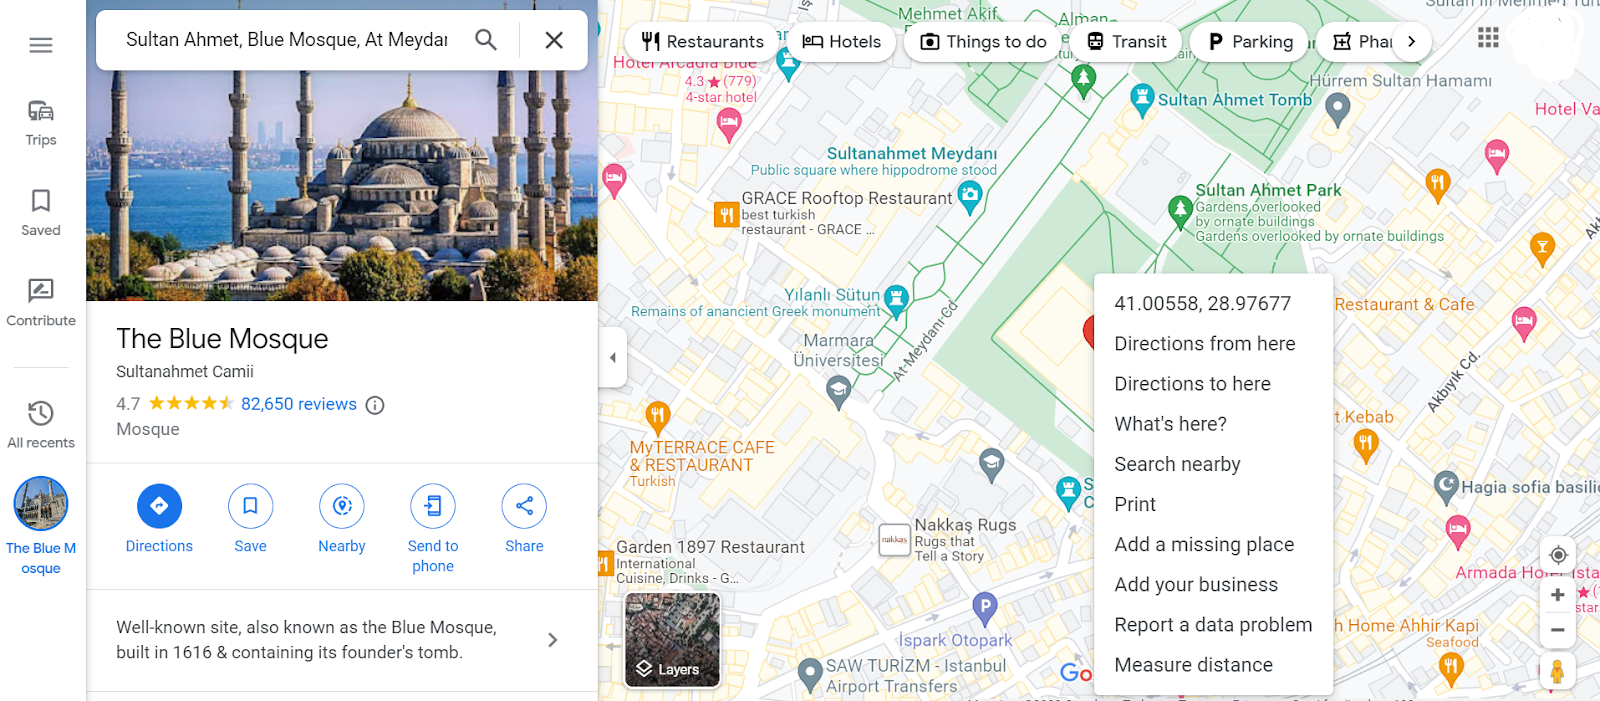
Then, paste the coordinate in the “Search” section in MapHub. The Blue Mosque is now interactively added to our map! At the same time, you can change the names of all the places added on the map with coordinates as you wish from the menu section on the right!

4. Saving Data
Every change made on the map must be saved in the “Save” section. Otherwise, the changes will disappear from your map.
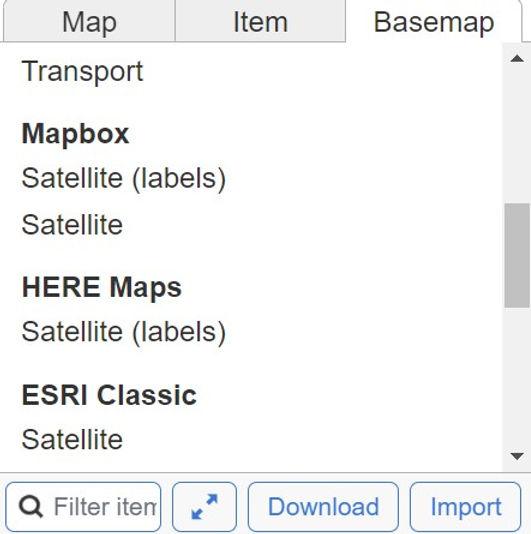
5. Selecting a Basemap
MapHub allows the user to choose their own base map. You can determine the color of your base, as well as use the map bases from software such as ESRI, MapBox, and Thunderforest.
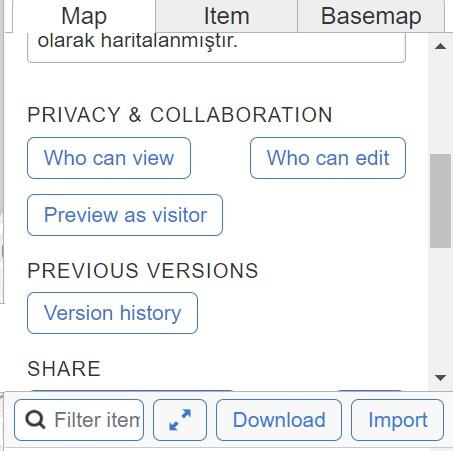
6. Adding a Title and Description
You can add titles and information to all maps you have prepared with MapHub.
7. Exporting Data
You can export data to your map in GeoJSON, KML/KMZ, GPX, Shapefile, ZIP, JPG, and PNG formats.
8. Grouping Data
It shows the feature of grouping your data. This way, you can separate each datum in your map into its group. You can show these groups with different icons and colors.
To summarize, the tools I have listed are essential features for preparing an interactive map on MapHub. You can also change your map’s design and the icons’ size and shape from the menu section on the right. After entering all the data and preparing the design, your interactive map is ready!
A great aspect of MapHub is the possibility to make your map open-access, letting other users benefit from your research.
With MapHub, we have the opportunity to organize thematic and multi-layered research processes beyond visualization with digital humanities methods. It is possible to make spatial analysis and thematic visualizations with a user-friendly interface and without requiring any software training.
[twitter-follow screen_name=’digiorientalist’ show_count=’yes’]

One thought on “MapHub: A Brief Tutorial”